
Fig 1. AI generated Image of an AI Agent
Section 1 : Introduction to AI Agents
What are AI Agents ?
An AI Agent is an autonomous program or system that perceives its environment, makes decisions, and performs actions to achieve specific goals. In the financial domain, AI agents are designed to assist users with tasks such as stock analysis, risk assessment, portfolio optimization, and financial planning.
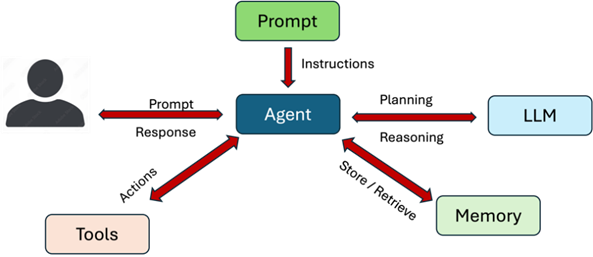
Fig 2. AI Agent Architecture
Components of an AI Agent
1. Perception:
-
How the agent gathers information (e.g., stock data from APIs, user queries).
-
Tools: Sensors, web scraping, APIs (like Yahoo Finance, Alpha Vantage).
2. Decision-Making:
-
How the agent processes data and makes decisions.
-
Tools: Machine Learning (ML), Natural Language Processing (NLP), rule-based systems.
3. Action:
-
What actions the agent performs (e.g., generating reports, creating visualizations, answering questions).
-
Tools: Visualizations (Plotly, Matplotlib), APIs for financial transactions.
4. Learning:
-
How the agent improves over time (e.g., using machine learning to refine predictions).
-
Tools: Supervised learning, reinforcement learning, transfer learning.
How AI Agents Work
-
User Interaction:
-
Users input queries or requests through a front-end interface (e.g., Gradio or a chatbot).
Environment Perception:
-
The agent collects data from external sources like stock market APIs (e.g., Yahoo Finance).
Data Processing:
-
Preprocessing: Cleaning and structuring data.
-
Analysis: Applying algorithms for prediction, optimization, or trend detection.
Decision-Making:
-
Leveraging AI models to interpret the data and answer user queries.
-
Example: Recommending whether to buy, sell, or hold a stock based on technical indicators.
Output and Feedback:
-
Providing the user with detailed responses, reports, or visualizations.
-
Example: An interactive stock price chart with moving averages.
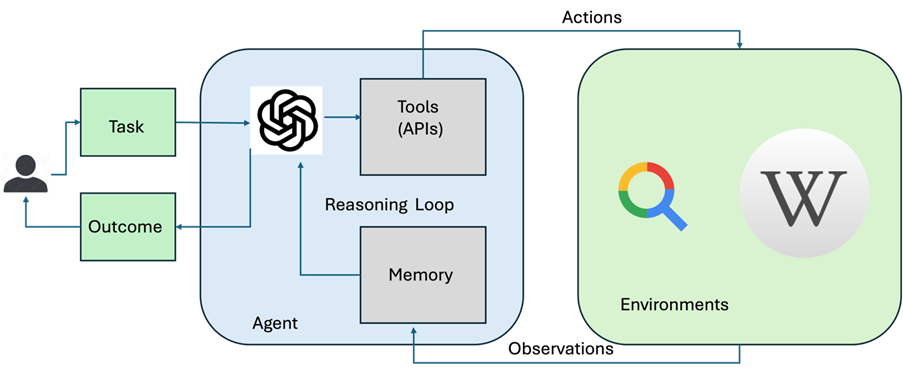
Fig 3. Agent Process Flow
Frameworks and Tools for Building AI Agents
AI agents can be built using a wide variety of frameworks and tools. Below are some common choices:
a. Natural Language Processing Frameworks
-
OpenAI API (GPT Models): For conversational agents and text-based insights.
-
Anthropic Claude: For natural, context-aware financial assistant interactions.
-
Hugging Face Transformers: For custom NLP models.
b. Data Collection and Processing
-
Yahoo Finance (yfinance): Fetch stock data and historical trends.
-
Alpha Vantage API: Access financial data for analysis.
-
Pandas/Numpy: For data manipulation and numerical computations.
c. Machine Learning Frameworks
-
Scikit-learn: For predictive modeling and clustering in finance.
-
TensorFlow/Keras: To build and train custom neural network models.
-
PyTorch: For flexibility in designing financial models.
d. Visualization Tools
-
Plotly/Dash: For interactive financial visualizations (e.g., candlestick charts).
-
Matplotlib/Seaborn: For quick, static plots.
-
Gradio: To create user-friendly interfaces.
Types of AI Agents
a. Reactive Agents
-
Definition: Reactive agents operate solely based on their current state and the immediate environment. They do not maintain memory or learn from past experiences.
-
Characteristics:
-
No internal state or history.
-
Respond directly to environmental stimuli.
-
-
Example:
-
Chess-playing agents that decide the best move based only on the current board state.
-
Spam filters that classify emails as spam or not based on predefined rules.
-
b. Model-Based Agents
-
Definition: These agents have a representation of the environment (a model) and use it to predict future states and make decisions.
-
Characteristics:
-
Maintain an internal state to represent the environment.
-
Use the model to reason and plan.
-
-
Example:
-
Navigation systems using maps to calculate routes.
-
A self-driving car predicting the motion of other vehicles.
-
c. Goal-Based Agents
-
Definition: These agents act to achieve specific goals. They use the state of the environment to plan and select actions that help them achieve these goals.
-
Characteristics:
-
Incorporate goal information into decision-making.
-
Can plan multiple steps ahead.
-
-
Example:
-
A robot navigating a maze to find the exit.
-
AI systems used in logistics for supply chain optimization.
-
d. Utility-Based Agents
-
Definition: Utility-based agents aim to maximize a utility function, which measures the desirability of outcomes.
-
Characteristics:
-
Optimize actions based on a measure of success or satisfaction.
-
Can weigh trade-offs between conflicting goals.
-
-
Example:
-
Portfolio optimization agents balancing risk and return.
-
Recommendation systems that maximize user engagement.
-
e. Learning Agents
-
Definition: These agents improve their performance over time by learning from their environment and past interactions.
-
Characteristics:
-
Use machine learning or reinforcement learning.
-
Adapt to changing conditions or goals.
-
-
Example:
-
Chatbots improving responses based on user feedback.
-
Anomaly detection systems adapting to evolving patterns in financial data.
-
f. ReAct Agents (Reasoning + Acting)
-
Definition: A ReAct agent combines reasoning and acting in a single framework, enabling it to both reason about its environment and take actions in real-time.
-
Characteristics:
-
Integrates logic-based reasoning with actionable responses.
-
Maintains a memory of past interactions to influence future decisions.
-
-
Example:
-
OpenAI's GPT-powered ReAct agents that answer questions and perform actions based on both the query and environmental context.
-
Virtual assistants (e.g., Alexa, Google Assistant) performing actions based on complex user queries.
-
Section 2 : Financial Agents
What are AI Financial Agents?
An AI Financial Agent is a software application or system powered by artificial intelligence that assists in managing financial tasks and processes. These agents leverage machine learning, natural language processing, and data analytics to make informed financial decisions, automate tasks, or provide insights. They are widely used in personal finance, business operations, and investment management.
Use Cases of AI Agents in Finance
1. Stock Analysis:
-
Performing technical and fundamental analysis on individual stocks.
-
Plotting charts with indicators like RSI, MACD, SMA.
2. Portfolio Optimization:
-
Balancing risk and return for an investment portfolio.
-
Generating strategies based on modern portfolio theory.
3. Market Prediction:
-
Using historical data to forecast market trends.
-
Employing time series models like ARIMA or LSTMs.
4. Financial Planning:
-
Personalized investment advice based on user goals.
-
Suggesting asset allocation strategies.
Challenges in Building Financial AI Agents
1. Data Quality and Availability:
-
Financial data can be noisy or incomplete.
-
Solutions: Use robust APIs and preprocessing techniques.
2. Complexity of Financial Markets:
-
Markets are influenced by countless unpredictable factors.
-
Solutions: Combine historical data with real-time news or sentiment analysis.
3. Bias and Fairness:
-
Ensuring that predictions and advice are free from bias.
-
Solutions: Regularly evaluate and fine-tune models.
4. Regulatory Compliance:
-
Financial applications are subject to strict regulations.
-
Solutions: Ensure transparency and document all decision-making processes.
Key Advantages of AI Financial Agents
-
Automation: Simplifies repetitive tasks like data analysis and reporting.
-
Speed: Provides near-instant responses to complex queries.
-
Personalization: Adapts advice based on user-specific needs.
-
Scalability: Handles multiple queries and users simultaneously.
Typical Workflow
Step 1: User inputs a query such as "Analyze AAPL stock performance over the last year."
Step 2: The agent retrieves data from Yahoo Finance using yfinance.
Step 3: Data is processed to calculate technical indicators (e.g., SMA, RSI).
Step 4: Visualizations are generated using Plotly for better understanding.
Step 5: An AI model (e.g., GPT-4) provides a textual analysis of the results.
Step 6: The user views the response and plots in an interactive interface.
Section 3 : Building an AI Financial Agent with Open AI and Gradio
In this Section we walk through creating an AI-powered Financial Analysis Agent that combines the power of OpenAI's GPT models with technical analysis capabilities and a user-friendly Gradio interface. The system allows users to analyze stocks through natural language queries and provides visual analytics and recommendations
Classification of the Financial Agent
The financial agent described here falls under multiple categories due to its capabilities:
-
ReAct Agent:
-
It reasons about user queries (e.g., interpreting what stock data is requested) and acts by fetching data, analyzing it, and generating visualizations.
-
-
Learning Agent:
-
If extended to improve responses or decision-making based on user feedback and new data, it can also be categorized as a learning agent.
-
-
Utility-Based Agent:
-
It seeks to optimize user satisfaction by providing valuable insights and visualizations, implicitly maximizing a utility function related to user goals.
-
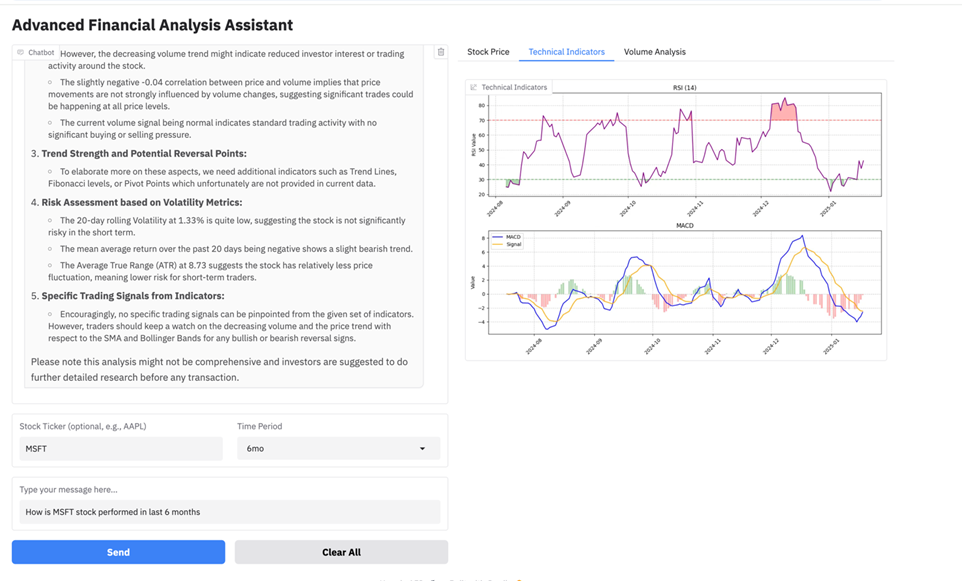
Fig 4. Financial Agent GUI with prompt and output
Python Code Help Manual
Note – The full code maybe downloaded from Github Link. Do check the APPENDIX section for explanation of the Financial Metrices computed and a few use cases to Explore
Github link for code download:
https://github.com/anishiisc/AI_AGENTS
Dependencies and Libraries
The script imports various libraries:
-
gradio: To build the front-end interface.
-
openai: To interact with OpenAI models.
-
matplotlib, seaborn, and plotly: For data visualization.
-
yfinance: To fetch financial data.
-
pandas, numpy: For data manipulation and analysis.
-
datetime, timedelta: For handling date and time operations.
-
yaml, re: For configuration and text processing.
-
mplfinance: For candlestick charts.
Why These Libraries?
-
yfinance: Provides historical stock price data.
-
Visualization libraries: Enhance insights with visual representations.
-
openai: Drives the AI's natural language understanding.
TickerExtractor Class
This class identifies stock ticker symbols from user input using both regex and OpenAI's GPT model.
Key Methods:
-
extract_from_text
-
Uses regular expressions to identify potential stock ticker symbols.
-
Verifies the validity of tickers using yfinance.
Example Regex Patterns:
-
\$([A-Z]{1,5})\b: Matches tickers prefixed by $, e.g., $AAPL.
-
\b([A-Z]{1,5})(?=\s+(?:stock|shares|equity)): Matches phrases like AAPL stock.
-
get_ticker_from_ai
-
Sends a prompt to OpenAI GPT for extracting the most relevant stock ticker from input text.
-
Verifies the suggested ticker with yfinance.
FinancialAgent Class
This is the main AI class that:
-
Extracts stock tickers.
-
Fetches financial data.
-
Performs technical analysis.
-
Generates actionable insights.
Key Components:
-
Initialization (__init__):
-
Sets up OpenAI client and TickerExtractor.
-
Defines a context message for GPT interactions.
get_stock_data:
-
Fetches historical stock data using yfinance.
-
Accepts parameters like ticker symbol and data period (e.g., 1y).
create_technical_analysis:
-
Computes various financial indicators:
-
Simple Moving Averages (SMA): Measures average prices over periods (e.g., 20 days).
-
Relative Strength Index (RSI): Identifies overbought/oversold conditions.
-
MACD: Tracks momentum trends.
-
Bollinger Bands: Identifies price volatility.
-
Volume SMA: Analyzes trading volume trends.
-
analyze_volume_patterns:
-
Provides insights into trading volume, including:
-
Average volume.
-
Volume trends.
-
Unusual trading activity.
-
analyze_technical_signals:
-
Generates trading signals based on:
-
RSI thresholds.
-
MACD crossover points.
-
Price vs. SMA comparison.
-
generate_market_insights:
-
Combines signals and volume analysis into a comprehensive insight report for a stock ticker.
Output Example:
-
Technical Indicators:
-
RSI: Neutral
-
MACD: Bullish
-
-
Volume Analysis:
-
Trend: Increasing
-
-
Risk Metrics:
-
20-day Volatility: 1.5%
-
FinancialPlotter Class
Provides visualization tools to display stock trends and technical indicators.
Key Methods:
-
create_stock_plot:
-
Plots candlestick charts with SMA overlays.
create_technical_indicators_plot:
-
Displays RSI and MACD trends.
-
Highlights overbought/oversold zones in RSI.
create_volume_analysis_plot:
-
Visualizes trading volume and its correlation with stock price.
Visualization Libraries Used:
-
matplotlib/mplfinance: For static candlestick plots.
-
plotly: For interactive volume analysis.
Integrating with Gradio
-
Gradio provides an interactive web-based front end.
-
Use the AI Agent as a chatbot to:
-
Accept user queries (e.g., "What is the analysis for AAPL?").
-
Display stock data, analysis, and charts.
-
Steps:
-
Define Gradio components:
-
Input: User text.
-
Output: Text or image (e.g., charts).
Connect the FinancialAgent methods to the interface.
Launch the app using gr.Interface().launch().
Putting It All Together
The full workflow:
-
User Input: Provide a query about a stock.
-
Ticker Extraction: Identify the stock ticker.
-
Data Fetching: Retrieve historical stock data.
-
Analysis: Generate technical indicators and insights.
-
Visualization: Display candlestick charts and indicators.
-
Response: Return insights via Gradio.
APPENDIX A – Financial Metrices
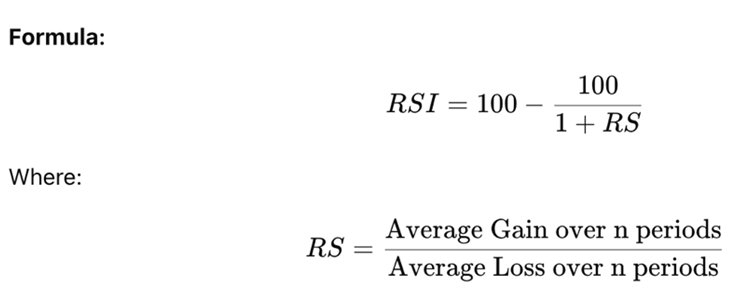
1. Relative Strength Index (RSI)
Definition:
-
RSI is a momentum oscillator that measures the speed and change of price movements. It is used to identify overbought or oversold conditions in a stock's price.
Key Points:
-
Value Range: RSI ranges between 0 and 100.
-
Thresholds:
-
Above 70: Indicates the stock is overbought (may indicate a potential price correction or pullback).
-
Below 30: Indicates the stock is oversold (may indicate a potential price rebound or recovery).
How It Works:
-
RSI compares the magnitude of recent gains and losses to determine whether the stock is being overbought or oversold.
-
Calculation Steps:
-
Compute the daily price changes (difference between consecutive closing prices).
-
Separate the price changes into gains (positive values) and losses (negative values).
-
Calculate the average gain and average loss over the specified period (default is 14 days).
-
Use the formula to compute RSI.
Application:
-
Traders use RSI to find potential reversal points.
-
Example: If RSI crosses below 30 and starts rising, it might signal a buying opportunity.
2. Moving Average Convergence Divergence (MACD)
Definition:
-
MACD is a trend-following momentum indicator that shows the relationship between two moving averages of a stock's price.
Components:
-
MACD Line: Difference between the 12-period EMA (fast) and the 26-period EMA (slow)
-
Signal Line: A 9-period EMA of the MACD line, used to generate buy and sell signals.
-
Histogram: The difference between the MACD line and the signal line, visually representing momentum.
Key Points:
-
Crossovers:
-
When the MACD line crosses above the signal line, it generates a bullish signal (buy).
-
When the MACD line crosses below the signal line, it generates a bearish signal (sell).
-
-
Zero Line:
-
When MACD is above zero, it indicates upward momentum.
-
When MACD is below zero, it indicates downward momentum.
-
How It Works:
-
The MACD line oscillates around the zero line, capturing the difference between short-term and long-term price trends.
-
Bullish Signal: MACD line crossing above the signal line while both are above zero.
-
Bearish Signal: MACD line crossing below the signal line while both are below zero.
Application:
-
Traders use MACD to identify trend strength, direction, and potential reversals.
-
Example: If the MACD histogram is increasing, it signals strengthening momentum.
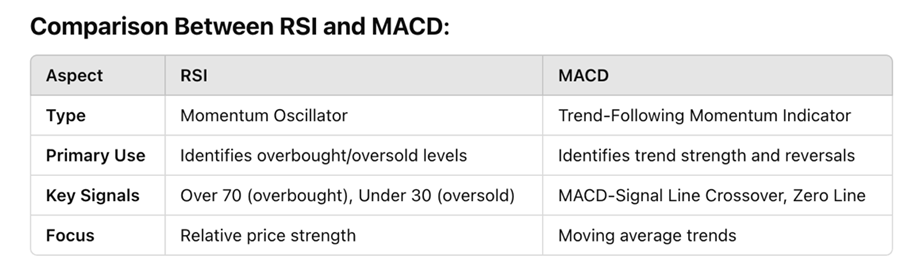
Comparison Between RSI and MACD:
APPENDIX B – Potential use cases with prompts
Use Case 1 :
Stock Analysis with Technical Indicators:
“Please analyze AAPL's technical indicators over the last 6 months. I'm particularly interested in the RSI and MACD signals for potential entry points.”
Use Case 2:
Volume Pattern Analysis:
“Can you examine the volume patterns for TSLA over the past year? I'd like to understand if there have been any unusual trading volumes and their correlation with price movements”
Use Case 3:
Volatility and Risk Assessment:
“Could you analyze the volatility of NVDA using Bollinger Bands and ATR? I want to understand if the current volatility is historically high or low.”
Use Case 4:
Please look at the SMA 20 and SMA 50 crossovers for MSFT over the last year. Have there been any significant golden or death crosses, and what were their implications?
Use Case 5:
Comprehensive Market Analysis:
“Can you provide a complete technical analysis for AMD including volume trends, momentum indicators (RSI/MACD), and price patterns? I'm considering a medium-term investment.”
Use Case 6
Multi-Timeframe Analysis:
“Could you compare META's performance across different timeframes (3 months vs 1 year)? I'm interested in seeing how the technical indicators change based on the time period.”
Use Case 7
Trading Volume vs Price Movement
Please analyze the relationship between trading volume and price movements for GOOGL. I'd like to understand if recent price changes are supported by volume.
This article was published on Linkedin on Jan 21, 2025.
Anish Roy Chowdhury is Associate Director of Data Science Institute, Plaksha University