
Maintenance of Waterpoints in Tanzania: A Data Driven Framework
Authors: Avishkar Rawal, Manya Mittal, and Nikita Jadhav
Published: 30/06/2026
Introduction
This research addresses the pressing issue of predictive maintenance for rural water points in Tanzania, a country where nearly 60% of water points become non-functional within 2 - 4 years after installation due to the kind of technology used at the time of installation (Joseph et al., 2018, p. 9). Access to clean water is not just a developmental target–it is a fundamental human right, and is crucial for achieving Sustainable Development Goal 6 (World Bank Blogs, 2016). Despite economic advancements, Tanzania continues to face challenges in sustaining its rural water infrastructure, primarily due to reactive, rather than preventive, maintenance systems (IRC, 2017).
While conventional water point mapping and manual reporting systems have increased visibility into system performance, they often operate retrospectively and lack modern analytical tools for early fault detection (Nyitambe et al, 2013, p.7). Despite growing datasets and increasing digitalization, artificial intelligence and machine learning remain underutilized in anticipating water point failures and guiding maintenance efforts, indicating a significant gap for more proactive, data-driven infrastructure management.
This study proposes a predictive model based on contextual factors - such as pump type, construction year, management, gps height etc, and failure histories to foresee the functionality of rural water points. The paper outlines the contextual background, presents a review of conventional and emerging approaches, details the methodology adopted, and concludes with findings that support a shift from reactive repair to proactive prevention.
Background and Significance
Tanzania's rural water infrastructure faces persistent challenges, with multiple factors contributing to the high failure rates of water points. Studies have identified unsustainable funding, lack of community involvement, and environmental issues such as seasonal droughts as primary causes of pump failures in many water supply schemes (World Bank Group, 2017, p.7). In response, the Tanzanian government introduced the National Water Policy in 2002, emphasizing community ownership and management to enhance sustainability in rural water supply projects (SNV Tanzania, 2010, p.9). This policy led to the establishment of Community Owned Water Supply Organizations (COWSOs), aiming to empower communities to select appropriate technologies, finance infrastructure, and maintain water points independently.
While the policy introduced a promising framework for localized management, its practical impact has been limited. Many communities still lack the capacity or institutional support to sustain these responsibilities. Only about 30% of Tanzania's 12,319 villages have active COWSOs, leaving the majority without structured water management systems (Mwendamseke et al., 2019, p.13). The Water Sector Development Programme (WSDP), designed to support implementation, allocated roughly 80% of its funding to constructing new water points, with little investment in long-term training and system maintenance (IRC, 2017). This approach has led to a recurring cycle of installation followed by neglect, resulting in widespread infrastructure breakdown (IRC, 2017).
As of 2025, an estimated 23 million Tanzanians still rely on unimproved water sources, posing substantial risks to public health and economic development (World Bank Blogs, 2016). In response to these challenges, data-driven efforts such as the DrivenData “Pump It Up” competition have encouraged the use of public datasets and crowdsourced solutions to better understand and address functionality issues in rural water systems (DrivenData, 2016).
Literature Review
Water Security as a foundation for Public Health
Water availability and safety are foundational to public health, particularly in low- and middle- income countries like Tanzania, where waterborne illnesses such as cholera, typhoid, and diarrhea remain prevalent. The discipline of public health, rooted in 19th-century sanitation reforms, has long acknowledged water as a social determinant of health, influencing outcomes from child mortality to economic productivity (World Bank Blogs, 2018). Within this framework, the reliability of water infrastructure becomes critical. Studies have shown that non- functional water points often correlate with increased disease burden and systemic inefficiencies in local health systems; for example, a study by Hunter et al. (2009) found that children under five who rely on unsafe water sources are nearly 20% more likely to suffer from diarrheal diseases.
Thematic: Water Point Functionality
Water point functionality refers to the operational status of a water source - typically categorized as functional, functional but needs repair, or non-functional. In rural contexts, especially in Sub- Saharan Africa, water points are often standalone handpumps or piped systems drawing groundwater. A functional water point consistently delivers water as intended; one that needs repair is still operational but with limitations (e.g., reduced flow, minor mechanical faults); a non-functional water point is entirely out of service. Assessing functionality is not a straightforward task. It involves not just technical performance, but also institutional (presence and effectiveness of local water committees or governance structures that oversee repairs and usage), environmental (seasonal variability in water availability, droughts, or contamination risks), and financial dimensions (availability of funds for maintenance, spare parts, and skilled technicians). Features influencing functionality include pump type, year of installation, water source reliability, depth to groundwater, quality of construction, frequency of maintenance, and the nature of community or institutional management. These features are often recorded irregularly, and classification varies across studies and surveys (Nyitambe et al, 2013).
Historical Discourse
The concept of water point functionality gained prominence during the early 2000s in countries like Tanzania and other African sub-Saharan countries with the introduction of National Water Policy (NAWAPO) in 1991. The Government of Tanzania aimed to provid e clean and safe water to the population within 400 meters of their households. (THE UNITED REPUBLIC OF TANZANIA MINISTRY OF WATER, 2025, p. 2). This attention grew during the Millennium Development Goals (MDG) era, a set of global targets agreed upon to improve human needs, including safe drinking water by 2015 under Water Supply Sanitation and Hygiene (WASH) (Joseph et al., 2018, p. 1). This policy also introduced local management community-Based Water Supply Organisations (CBWSOs also referred to as COWSO in Mwendamseke et al., 2019), which manage water schemes, collect water tariffs, and manage operational and maintenance costs. Led by elected village members, CBWSOs hire technicians and accountants. By June 2024, 1,018 CBWSOs served 9,203 villages. The schemes faced issues like poor leadership, low willingness to pay, and infrastructure damage. (THE UNITED REPUBLIC OF TANZANIA MINISTRY OF WATER, 2025, p. 16).
During this time, global policy emphasized rapid infrastructure deployment and expansion of water supply services to provide access. In Tanzania, this translated into the launch of the Water Sector Development Programme (WSDP) around 2006, which was a 20-year government plan aimed at expanding water supply. (THE UNITED REPUBLIC OF TANZANIA, 2006, pp. 2–2). This led to the widespread construction of water points like borewells, wells, and handpumps across Tanzania, especially in rural areas. This rapid infrastructure deployment was meant to help Tanzania meet its MDG target of increasing safe water access. However, this rapid expansion revealed a major problem: sustainability. A paper reporting data analysis of 83,000 water points reports that nearly 29% of Tanzania’s rural water points were non-functional, with a significant number failing within just one year of installation. In fact, a likelihood of 20% waterpoints failing in the rural regions of Tanzania within the first year of installation. (Joseph et al., 2019, p. 19).
Evidently, Tanzania was far from reaching its MDG goals of providing clean water access to everyone by 2015. A report by the World bank commented that Tanzania had the “smallest gains in improved water coverage” when MDG was in action, with about 21 million of its 55.6 million people lacking access to improved sources of water. (Joseph et al., 2018, p. 1).
This pattern led to a “build-neglect-rebuild” cycle, which occurred because after initial construction, insufficient attention and resources were given to operation and maintenance, leading to deterioration and the need for rebuilding. Despite a positive outlook in the GDP of Tanzania, and its consistent efforts into spending expenditure of water, the impact in gaining water access was limited as shown in appendix fig a. (Joseph et al., 2018, p. 6).
Pre-AI Era
Recognizing the need for better information on water point status, Tanzania began implementing Water Point Mapping (WPM) in the mid-2000s. Initiated by NGOs such as WaterAid and later adopted by the government, WPM involved physically locating and recording water points using GPS devices, then collecting data on their functionality, technology type, and usage. Between 2005 and 2009, pilot projects mapped over half of Tanzania’s rural water districts, and by 2010, the government institutionalized WPM as the main tool for monitoring rural water supply. The data collected through WPM was uploaded to the Water Point Mapping System (WPMS), an online database managed by the Ministry of Water. This data helped identify areas with poor water access and non-functional water points, enabling better resource allocation and planning. Despite these advances, WPM had limitations. Data updates were often manual and paper-based, leading to delays and outdated information. Visual inspections, rather than laboratory tests, were often used to assess water quality, resulting in only 62% accuracy in status classification (Nyitambe et. al, 2013, pp. 5–12).
Building on early WPM efforts, SNV Tanzania’s 2007–2008 implementation across 10 districts showed how visualizing and analysing water point data can uncover critical patterns in service functionality and management. Their analysis revealed critical relationships between functionality and factors such as payment systems (where points with monthly or per-bucket payment showed 100% functionality versus 0% for annual payment schemes), management models (privately managed points consistently outperformed government-operated ones), and infrastructure age (with clear patterns of deterioration over time). The mapping also highlighted stark inequities in water point distribution between and within districts, with some areas exceeding national coverage standards while others remained severely underserved. SNV's validation process identified that 43% of all mapped water points were non-functional, translating to approximately 655,000 people without reliable water service despite infrastructure investments. These findings exposed fundamental sustainability challenges, including weak community ownership, inappropriate technology choices, inadequate maintenance systems, and financial mismanagement- issues that persisted despite Tanzania's progressive water policy framework (SNV Tanzania, 2010, p.1-9 ). Coverage in some rural areas remained incomplete, and the system lacked real-time monitoring capabilities. These challenges highlighted the need for more dynamic and responsive tools.
Researchers at the University of Twente developed the SEMA (Sensors, Empowerment and Accountability in Tanzania) app in 2014 as a mobile phone-based solution to address the reporting gap between villages and district water departments. This innovation aimed to overcome WPM's update limitations by enabling real-time water point functionality reporting directly from rural water users to district water engineers, effectively connecting the last mile of the water monitoring infrastructure and carefully constrained crowdsourcing parameters to generate reliable water point status data. (Lemmens et al., 2017).
Post-AI Era
As Tanzania continues to build on these foundations, the introduction of artificial intelligence (AI) and advanced data analytics is poised to transform water point functionality monitoring and management further. AI offers the potential to analyze large datasets from platforms like SEMA and WPMS, predict failures before they occur, optimize maintenance schedules, and enhance decision-making at all levels of water governance. The debate around water point functionality has evolved from one focused on technology and installation to one concerned with accountability, data quality, and long-term planning. Functionality today is increasingly viewed not as a binary state, but as an outcome shaped by technical, social, and environmental factors - all of which must be addressed to ensure sustainable water access.
Contemporary Debate
The more promising approaches began to emerge when AI was deployed, signifying some of the current models that are being used to use the data collected pre-AI.
Model 1: Data-Driven Approaches to Water Point Functionality Classification
The "Pump it Up: Data Mining the Water Table" competition, hosted by DrivenData, is an open, intermediate-level machine learning classification problem focused on improving water access in Tanzania. The competition utilizes real-world data from the Tanzanian Ministry of Water and the Taarifa platform, encompassing 59,400 labeled training entries and 14,850 test entries. There are over 18,000+ participants as per the records of date 16th May 2025, and the competition is open till October. (DrivenData, n.d.) Through participation in this competition we leveraged ML models to gain insights and understand the waterpoint access problem in Tanzania.
Our team ranked at 1517 achieved a classification accuracy of 0.8215, landing us in the top 8% and the discussion regarding our methodology on this problem is in section 4.1. An examination of the leaderboard reveals a narrow band of high-performing score. The highest scorer has achieved a classification accuracy of 0.8299 (DrivenData, n.d.).
The competition served as a practical demonstration of the importance of rigorous preprocessing, feature engineering, and model ensembling. Most top competitors employed tree-based methods- particularly random forests. We utilized blogs and Medium postings, and the DrivenData discussion forum and their github repositories, to learn about the previously introduced models for this classification problem.
- For instance, Brenda Loznik, a data scientist who ranked in the top 4% of competitors, utilized an ensemble of XGBoost and random forest with weighted voting classifier and fine-tuned the model using gridSearch techniques (Loznik, 2022b).
- A capstone project of Data Science MS students at Northwestern University called Daftpumps achieving a final classification accuracy of about 82.5%, which placed them in the top 1% of the competition, used random forest and h20 implementation. They also built a dashboard to using data visualization tools like Tableau, R shiny’s, and Bokeh (Austin Harrison, 2018).
- Another successful approach came from Matthew Brown, who placed ninth-place in 2017 with an accuracy of .8247 (DrivenData Community Share Your Approach!, 2016), using an ensemble of eleven XGBoost models with different hyperparameters. (MattBrown, n.d.).
- Similarly, another participant argued that with many categorical features, a gradient‐ boosted tree like CatBoost was ideal; he trained a CatBoostClassifier with 10,000 iterations, max_ctr_complexity=5, early stopping (od_wait=500), and multi-class loss. (Baranyuk, 2021).
- H2O’s Random Forest was also applied, reportedly with many trees (e.g. ntrees=1000 achieving ~0.821 accuracy. (Dipetkov, n.d.).
In short, all top approaches used ensemble trees (random forests or gradient boosting). Some also experimented with other learners. These examples underscore the centrality of tree-based models in this context.
One interesting trend among competitors was the relative rarity of neural network models. While some experimented with deep learning architectures, these often underperformed compared to tree based ensemble ML methods. A forum participant noted that even a two-layer neural network capped out at 54–55% accuracy, indicating that classical models like random forests and boosting methods were better suited for this structured data (DrivenData, n.d.).
Model Type | Usage/Popularity | Accuracy | Key Features/Remarks |
Random Forest | Often combined with XGBoost and CatBoost in ensembles (e.g., Brenda Loznik) | ~0.8235 | Effective with categorical data; added diversity in ensembles |
XGBoost (Ensemble of 11 models) | (e.g., Matthew Brown, 9th place in 2017) | ~0.8247 | Tuned with grid/random search; used label/frequency encoding; ensembled with varying seeds |
CatBoost | Preferred for categorical features (e.g., Sagol) | ~0.824–0.825 | Handled categorical variables natively; robust even with default settings |
Gradient Boosting Machines (general) | Used in various implementations; core of most high-performing solutions | ~0.8260–0.8280 | Strong performance on tabular data; includes XGBoost, CatBoost, LightGBM variants |
Shallow Neural Networks | Rarely used; consistently underperformed | ~0.54–0.55 | Poor fit for tabular data; failed to outperform tree-based models |
Logistic Regression | Used as a simple baseline (e.g., Brenda Loznik) | ~0.667 | Easy to implement; insufficient for capturing complex interactions |
Table 1: Summary of the models used by participants of Pump it Up Competition
Hyperparameter optimization using grid or random search algorithms was a routine step. Participants tuned parameters such as learning rate, tree depth, and subsampling rates to maximize generalization performance. Loznik describes first conducting randomized searches or visualization of parameter effects, then focused grid‐searches on the best models. She offered an insight into the tuning method expressing no more than 200 trees were required for a random forest (Loznik, 2022b). Matthew Brown indicates using a “low eta (learning rate) and a large number of iterations” in XGBoost(DrivenData Community Share Your Approach!, 2016), but suggests that spreading effort across multiple model ensembles yielded better returns than a single very slow model. Across competitors, grid‐search and random-search were common; none of the high-placed solutions report exotic Bayesian tuning, just exhaustive/ manual search. Explicit ranges/values were seldom published, but hints include RF with ~100–200 trees, XGBoost eta ≈ 0.01–0.1, depth and subsample tuned via grid, etc.
The relatively high classification accuracy achievable by these models indicates their potential for deployment by local governments and NGOs working on water infrastructure in Tanzania. As data collection becomes more consistent and comprehensive, the integration of these predictive systems could significantly enhance the sustainability and reliability of rural water supply networks.
Model 2: Telemetry and Remote Sensing-Driven Pump Functionality Classifier by Thomas et al. 2021 paper
In the section, Contemporary Debate, we discussed different kinds of models used to solve the waterpoint classification problem of Tanzania within the DrivenData competition ‘Pump it Up’. This area of research is niche. We did not want to limit our research to just one dataset but contemporary research on Tanzania waterpoint classification problem is predominantly done under only Driven Data competition. So, we looked at the following model which differs from our problem but is relevant.
Performance metric | Expert classifier | Machine learner |
All data (running and non-running pumps) | ||
True positive rate (sensitivity) | 82.1% | 84.5% |
True negative rate (specificity) | 47.8% | 63.0% |
Positive predictive value | 90.9% | 93.6% |
Negative predictive value | 29.5% | 38.9% |
Usage observed (running pumps) | ||
True positive rate (sensitivity) | 100.0% | 100.0% |
True negative rate (specificity) | 0.0% | 0.0% |
Positive predictive value | 99.1% | 99.1% |
Negative predictive value | NA | NA |
No usage observed | ||
True positive rate (sensitivity) | 56.2% | 62.1% |
True negative rate (specificity) | 49.4% | 65.2% |
Positive predictive value | 75.0% | 82.8% |
Negative predictive value | 29.5% | 38.9% |
Table 2: Classifier Performance for Expert Classifier and Machine Learner wherein a True Positive is a functional pump capable of delivering water regardless of actual current use, and a True Negative is a broken pump incapable of delivering water without a rep
Thomas et al. (2021) developed an ensemble machine-learning classifier for rural pump functionality by combining in-situ telemetry with remote sensing data. While the focus is on improving drought resilience in East Africa through groundwater pump monitoring using in-situ instrumentation, remote sensing, and machine learning, they also aim to develop classification systems to identify functional and non-functional electrical pumps in arid regions of Kenya and Ethiopia to support water supply operation and maintenance. In their study in Kenya and Ethiopia, 480 electric groundwater pumps were fitted with sensors to record pump use. The authors built two classifiers – an expert-informed conditional classifier system and a data-driven ensemble Machine Learner. They stacked multiple base learners like several XGBoost configurations, Lasso and Ridge regressions, random forest to optimize performance, using cross-validation to weight the models. This ensemble ML thus captured complex nonlinear patterns in pump usage driven by both drought and hydrological context. The expert classifier predicts pump status using mapped-out logic statements that are easily followed. It relies on domain knowledge expertise, which is subjective and may not represent a consensus view. Daily pump status classifications include “NULL”, “OFFLINE”, “LOW USE”, “NORMAL USE”, “SEASONAL DISUSE”, “NO USE” and “REPAIR” with classifications made on a site-to-site basis. A 7-day averaging period is used to reflect the typical work week, and 10 mm of rainfall is the threshold for "moderate rainfall" using CHIRPS data.
The results showed strong diagnostic power. The machine-learner achieved about 84% sensitivity (true-positive rate for detecting working pumps) versus 82% for the expert classifier. When pumps were in use (i.e., truly functional) both methods had a 100% true-positive rate, but when pumps were not used the ML model had higher specificity (~65%) than the expert system (~50%).
In practical terms, Thomas et al. estimate that integrating this classifier into maintenance logistics could raise drought-season pump uptime from ~60% to ~85%, a ~40% reduction in relative downtime risk. Overall, this model demonstrates a technically efficient, data-driven approach - using real-time sensor telemetry plus remote sensing features - to accurately predict water-point reliability, improving on static rule sets and guiding prioritized repairs.
Gap in the Research
Despite the advancements in understanding and managing water point functionality, several research gaps remain:
- Integration of AI and Real-Time Data: There is a need for more research on integrating AI and real-time data collection methods, such as IoT sensors, to enhance predictive maintenance models. Current studies often rely on static datasets that do not reflect real- time conditions.
- Longitudinal Studies: More longitudinal studies are required to assess the long-term effectiveness of AI and ML interventions in predicting water point failures and improving maintenance strategies. This would help in understanding the sustainability of these approaches over time.
- Community-Centric Approaches: Research should focus on developing community- centric models that incorporate local knowledge and practices. Engaging communities in the data collection and analysis process can lead to more accurate predictions and better maintenance outcomes.
- Policy Implications: Further research is needed to explore the policy implications of implementing AI and ML in water management. Understanding how these technologies can be integrated into existing governance frameworks will be crucial for their successful adoption and scalability.
Addressing these research gaps can significantly enhance the effectiveness of predictive maintenance strategies for rural water points in Tanzania, ultimately contributing to improved access to clean water and better public health outcomes.
Methodology
Framing the Research Gap
How can machine learning models, trained on publicly available water point data, enable proactive maintenance and equitable resource allocation in Tanzania’s rural water sector despite data limitations and sparse AI/ML adoption?
Programs like Water Point Mapping (WPM) and Community-Owned Water Supply Organizations (COWSOs) have collected data on ~74,000 water points since the early 2000s, but these datasets remain static, incomplete, and underutilized. Unlike sectors like healthcare and finance that use decades of data for machine learning, Tanzania’s water sector still depends on manual surveys. The DrivenData competition’s public dataset of 59,400 water points offers an opportunity to apply ML at scale.
Proposed Argument
By prioritizing the DrivenData competition, machine learning can deliver nationwide insights for proactive maintenance and resource allocation. Our approach integrates supervised machine learning models with strategic feature engineering, allowing for novel insights into improving the accuracy of water point failure classification.
Description of Dataset
The dataset used in this analysis comes from the "Pump It Up: Data Mining the Water Table" competition, which is hosted by DrivenData. The data was collected by the Ministry of Water in Tanzania in collaboration with Taarifa. The data 59400 entries in the data with a total of 41 different attributes. 10 columns are continuous (3 float type, 7 integer type), and the remaining 31 columns are categorical columns. The target variable is also a categorical column, with 3 categories: {functional, non-functional, functional but needs repair}.
Exploratory Data Analysis and Data Visualization
- There is a class imbalance in the target variable, status_group (54% functional, 38% non-functional, 7% functional but needs repair), as shown in Appendix I Fig. c
- The region-wise scatter of each class is shown in Appendix I, Fig. b
- There are no missing values in the continuous columns, as shown in Appendix I fig d. However, zeros in columns like longitude and construction year mask the null values.
- There are missing values in categorical columns, as shown in Appendix I fig. e
a. There are columns with duplicate or repetitive information: {quality, quality_group}
b. {quantity,quantity_group},{source_type,source},{waterpoint_type_group, waterpoint_type}, {payment, payment_type}
c. The recorded_by column has one unique value (GeoData Consultants Ltd) - common for all rows
d. The date_recorded column shows that all the data is recorded in the span of just two years
Data Preprocessing
Based on the insights from the data quality report, we performed preprocessing. Our Python- based pipeline addresses data scarcity through:
- Missing Data Handling:
a. Categorical columns
i. Columns with a high percentage of Null values were dropped, e.g., scheme_name(48.5%)
ii. For other columns, null values were replaced by the word, other
b. Numerical gaps:
i. None of the columns had null values, but some columns had a lot of zeros.
ii. Construction year and Longitude(29 to 41) had the zeros in them, which is not possible for Tanzania.
iii. We used the KNN imputer to impute relevant values in place of zeros for the Construction year and used forward fill for longitude.
iv. 21381 (36%) rows had a value of zero for the attribute population.
v. We considered various categorical columns like payment type, quantity, and status_group (for training data only) for considering that entry to be imputed using KNN imputer. - Dealing with categorical variables using
a. Three primary encoding strategies were assessed. Each encoding method was applied prior to training a baseline classification model.
i. Label Encoding
ii. Frequency
iii. Label Encoding with Rare Category Grouping
Feature Engineering:
- Introduced new featuresa. raininess_score categorizes seasons (e.g., 4 = March-May) to model rainfall’s impact on pump wear.
b. We engineered a new column age of the water point during the survey using the construction_year date_recorded column. - Duplicate and Redundant Column Removal:
a. Duplicate Columns like wpt_name and extraction_type were dropped to reduce noise.
b. Redundant columns like water_point name, data collector are also dropped. - Dimensionality Reduction with PCA after Label Encoding (Random Forest): Appendix I, Fig. g illustrates how the random forest model accuracy changes with varying numbers of PCA components. When the number of components is low (around 10 to 14), accuracy drops from approximately 0.715 to 0.709, suggesting that excessive dimensionality reduction may discard important information. From 15 to 22 components, performance remains relatively flat, with only minor fluctuations in accuracy. Notably, a consistent upward trend begins around 23 components, with accuracy peaking at approximately 0.7245 when 33 components are used. This indicates that retaining more principal components helps preserve valuable features, ultimately enhancing model performance. Optimal results were observed with 30 to 33 PCA components.
- Feature Importance Analysis for Random Forest (label encoding): Appendix I Fig h highlights the top 15 features influencing model performance. Longitude and latitude are the most impactful, followed by quantity_group, id, and quantity. Mid-level features like subvillage, gps_height, and waterpoint_type_group also contribute significantly. While lower-ranked features such as extraction_type_class and extraction_type_group have less impact, they still play a role in prediction accuracy.
Why is our approach unique
This proposal uniquely addresses Tanzania’s water management challenges by combining context-aware preprocessing techniques, such as seasonal feature engineering and informed data imputation.
- Key Innovations:
a. Raininess Score for Seasonal Context and age of the water pump: The raininess_score categorizes months into seasons (e.g., 4 = March- May) to model how rainfall patterns impact pump wear and failure. For example, pumps in regions with heavy rains may experience higher mechanical stress, leading to faster degradation. This temporal feature is critical in Tanzania’s climate but often ignored in static datasets.
b. The engineered column age also helps us get insight into the status of the water point because they are prone to failure as they age. - Data Imputation:
a. Missing values that were masked by zeros for numeric columns were imputed using the categorical values using KNN imputer, rather than just using mode or mean. This approach preserves contextual relationships between variables, ensuring the imputed values align with the geographical, technical, and socio- economic characteristics of each water point.
b. Encoding experimentation
c. Label encoding with rare encoding - Infrequent categorical values were grouped under an "Other" category before applying label encoding
d. Frequency Encoding - This method replaces categorical values with their frequencies in the dataset.
e. Label encoding - Without any rare category grouping, pure label encoding
Model / Encoding Method | Accuracy | Macro F1 | Notable Strength |
Label Encoding + Rare Category | 0.8106 | 0.69 | Strong general performance |
Frequency Encoding | 0.8113 | 0.69 | Slightly improved consistency |
Label Encoding | 0.8125 | 0.69 | Comparable to other encodings, but best results |
Table 3: Encoding technique vs their performance
Model Selection:
- KNN: We started with the simplest classifier, which is KNN (K Nearest Neighbour). We got an accuracy of 0.5275 by only using the numeric columns and it bumped to 0.7185 when we included the label-encoded categorical columns.
- Random Forest: After KNN we explored Random Forest, a group-based machine learning algorithm (known as an ensemble method) that builds multiple decision trees and combines their outputs for more accurate and stable predictions. As mentioned in the contemporary models section, this was the most popular algorithm for this classification problem hence it was the natural next choice for us in the model building.
- XGBoost(Extreme Gradient Boosting): After exploring Random Forest, we moved on to a more advanced model — XGBoost (Extreme Gradient Boosting), which is an ensemble method that builds multiple decision trees using gradient boosting. This means each tree is built sequentially to correct the mistakes made by the previous one, enabling the model to learn more effectively from the data. Unlike Random Forest, which grows trees independently, XGBoost leverages this iterative learning to improve accuracy. We chose this model because its boosting framework is particularly effective for structured, tabular data like ours, and it often achieves strong performance in real-world competitions.
- CatBoost: Building on our experimentation with XGBoost, we next explored CatBoost, another ensemble method that also uses gradient boosting to construct decision trees. What sets CatBoost apart is its ability to handle categorical features automatically, which significantly reduces the need for manual preprocessing. Given that our dataset contains many categorical variables with numerous unique values, CatBoost was a natural choice to simplify feature handling while still achieving high accuracy.
- Neural Network: In addition to traditional models, we explored a Neural Network- a machine learning model inspired by the human brain’s structure. It consists of layers of interconnected nodes (neurons) that process data through weighted connections and activation functions. Neural networks are particularly powerful for capturing complex, non-linear relationships. We selected this model to uncover hidden patterns in the data that simpler models might overlook, especially given the diverse combination of numeric and categorical features in our dataset.
Soft Voting Ensemble
To capitalize on the strengths of different classification models, we used a soft voting ensemble, which combines multiple classifiers – namely Random Forest, XGBoost, and LightGBM – by averaging their predicted probabilities and selecting the class with the highest combined score.
We chose this approach because each model captures different patterns in the data, and combining them helps produce more balanced and accurate predictions.
Hyperparameter Tuning
Enhancing model performance further required fine-tuning hyperparameters — configuration settings like learning rate or tree depth that guide the training process. To automate this process, we leveraged Optuna, an open-source framework that efficiently searches for optimal hyperparameters using advanced methods such as Bayesian optimization. With Optuna, we optimized our Random Forest model, achieving peak accuracy with these settings:
{'n_estimators': 195, 'max_depth': 22, 'min_samples_split': 4, 'min_samples_leaf': 1}.
Findings and Results
Visualization of Data Analysis
We observed that the Random Forest model optimized using Optuna achieved the highest classification accuracy of 0.8215, as shown in Table 4. This result placed us in the top 8% of participants in the DrivenData competition. A visual comparison of model performance is provided in Appendix I Fig. i.
Model | Accuracy |
Random Forest (optimized Hyperparameters) | 0.8215 |
Frequency Encoding | 0.8113 |
Label Encoding + Rare category | 0.8106 |
XGBoost | 0.8098 |
Soft Voting Ensemble | 0.8074 |
Catboost | 0.8011 |
RF with K-fold target Encoding(k=15) | 0.7960 |
RF with K-fold target Encoding(k=150) | 0.7954 |
KNN (with encoded categorical columns) | 0.7185 |
Neural Network | 0.6552 |
KNN numerical Columns | 0.5375 |
Table 4: Lists all the models that we employed and their best performance
Main Findings and Insights
Among the models tested, tree-based methods performed best. Random Forest, in particular, was effective at handling the mix of categorical and numerical data, it captured non-linear relationships well. However, all models struggled to correctly classify the "functional but needs repair" category. This was likely due to a combination of class imbalance and a lack of clear features that separate this group from fully functional or non-functional water points.
To address this, we applied SMOTE (Synthetic Minority Oversampling Technique) to oversample the minority class. But the improvement was marginal, the synthetic examples didn’t reflect the true variability in the data, and precision for the minority class classification remained low. This suggests that simply increasing the sample size isn’t enough when the underlying feature space doesn’t offer strong signals.
Another limitation came from the nature of the dataset itself. Our data was static, and lacked the real-time indicators that could signal early signs of failure. Other studies that used telemetry data (e.g., sensor readings and continuous monitoring) reported better results, with higher accuracy and earlier detection of failing systems. This comparison demonstrated how richer, time-based data can significantly improve predictive performance in this context.
How Main findings/insights answer the Research Question our research question was:
“Can we predict the functionality of water points in rural Tanzania?”.The findings show that it is possible to a reasonable degree using machine learning models, particularly tree-based methods like Random Forest, which performed best overall due to their ability to handle mixed data types and capture non-linear relationships. However, predicting the “functional but needs repair” class proved difficult across all models, primarily due to class imbalance and limited feature information. Even with techniques like SMOTE, performance on this minority class remained low.Interestingly, neural networks showed slightly better recall for this underrepresented class, suggesting their potential value in use cases focused specifically on early fault detection. Thus, the study reinforced that while predictive modeling is viable, model effectiveness is closely tied to the quality of data. Real-time telemetry data, such as that used in other studies with sensor inputs, could offer a significant improvement in identifying early-stage pump failures.
Conclusion
This study shows that using machine learning (ML) to shift Tanzania's reactive approach to managing its rural water infrastructure to a proactive one is both feasible and promising. We created and evaluated many machine learning models using the publicly accessible "Pump It Up" dataset, with a Random Forest classifier obtaining a maximum accuracy of 82.15%. We also trained multiple gradient boosting methods, but the Random Forest model outperformed them all. Imputing spatial(longitude) and temporal(age) features and adding a raininess score are examples of feature engineering that were crucial for improving model performance. Despite their poor overall accuracy, neural networks may be crucial for early-stage flaw identification because of their better recall for the "functional but needs repair" class.
Our study emphasizes the significance of real-time data integration by including results from related programs, including the SEMA platform and Thomas et al.'s remote sensing-based classifier. These studies demonstrate that ensemble models and sensor-driven telemetry can perform better than static models, increasing the accuracy of classification and the speed of detection. Our static dataset's shortcomings, including class imbalance, out-of-date records, and regional data anomalies, underscore the pressing need for sensor-based, dynamic data collection and longitudinal assessment frameworks.
Moreover, while our technical model offers predictive power, long-term success depends on socio-political integration. The absence of active Community-Owned Water Supply Organizations (COWSOs) in over 70% of Tanzanian villages, limited community engagement, and policy gaps undermine sustainable outcomes.
By addressing these dimensions – technical, community-driven, and policy-oriented – Tanzania can build a more resilient, equitable, and data-informed rural water system. This multidimensional approach is critical for advancing Sustainable Development Goal 6: ensuring availability and sustainable management of water and sanitation for all.
References
- Austin Harrison. (2018, June 5). NU MSDS 498 Capstone Presentation - Daft Pumps [Video]. YouTube. https://www.youtube.com/watch?v=C8-_taziGBU
- Baranyuk, T. (2021, February 21). CatBoost and water pumps. DEV Community. https://dev.to/sagol/catboost-and-water-pumps-4lbe
- Dipetkov. (n.d.). GitHub - dipetkov/DrivenData-PumpItUp. GitHub. https://github.com/dipetkov/DrivenData-PumpItUp
- DrivenData. (2016, republished 2025). Pump It Up: Data mining the water table. https://www.drivendata.org/competitions/7/
- DrivenData. (n.d.). Pump it Up: Data Mining the Water Table. DrivenData. https://www.drivendata.org/competitions/7/pump-it-up-data-mining-the-water-table/page/25/
- eWater. (2017). A clean water system for those who need it, in real time. RTInsights. https://www.rtinsights.com/ewater-clean-water-system-with-payment-taps/
- Hunter, P. R., Zmirou-Navier, D., & Hartemann, P. (2009). Estimating the impact on health of poor reliability of drinking water interventions in developing countries. Science of the Total Environment, 407(8), 2621–2624. https://doi.org/10.1016/j.scitotenv.2009.01.018
- IRC. (2017). Rural water supply access in Tanzania: why has it stagnated. https://www.ircwash.org/blog/rural-water-supply-access-tanzania-why-has-it-stagnated
- IRC. (2017). Understanding what drives maintenance of rural water infrastructure in Tanzania. https://www.ircwash.org/blog/understanding-what-drives-maintenance-rural-water- infrastructure-tanzania-and-it%E2%80%99s-not-what-you
- Joseph, G., Andres, L. A., Chellaraj, G., Zabludovsky, J. G., Ayling, S. C. E., & Hoo, Y. R. (2019). Why do so many water points fail in Tanzania? An empirical analysis of contributing factors. Policy Research Working Paper, WPS8729. https://www.researchgate.net/publication/333827509
- Joseph, G., Haque, S., Ayling, S., World Bank, & Swedish International Development Cooperation Agency. (2018). Reaching for the SDGs: the untapped potential of Tanzania's water supply, sanitation, and hygiene sector [WASH Poverty Diagnostic]. World Bank. https://www.worldbank.org
- Lemmens, R., Lungo, J., Georgiadou, Y., & Verplanke, J. (2017). Monitoring Rural Water Points in Tanzania with Mobile Phones: The Evolution of the SEMA App. ISPRS International Journal of Geo-Information, 6(10), 316. https://doi.org/10.3390/ijgi6100316
- Mwendamseke, E., Traini, L., Fierro, A., & Nelaj, E. (2019). Rural water supply management in Tanzania: An empirical study on COWSO strategy implementation, private sector participation and monitoring systems. JUNCO – Journal of UNiversities and International Development Cooperation, (n. 2/2017), 37. https://doi.org/10.13140/RG.2.2.23128.24329
- Nyitambe, J. E., Mwakalila, S., & Kombe, W. J. (2013). Water point mapping system (WPMS) governance and service delivery: Case study Tanzania. UNU-FLORES. https://i.unu.edu/media/flores.unu.edu-en/news/2987/09-Nyitambe-Water-Point-Mapping- System-WPMS-Governance-and-Service-Delivery.-Case-Study-Tanzania-Rural-Water- Supply.pdf
- Share your approach! (2016, August 5). DrivenData Community. https://community.drivendata.org/t/share-your-approach/65/21?page=2
- SNV Tanzania. (2010). Water point Mapping: The experience of SNV Tanzania. Tanzania and SDG 6: Improving water supply and sanitation can help Tanzania achieve its human development goals. (2018). World Bank Blogs. https://www.worldbank.org/en/news/press- release/2018/03/20/improving-water-supply-and-sanitation-can-help-tanzania-achieve-its- human-development-goals
- THE UNITED REPUBLIC OF TANZANIA. (2025). Water Sector Development Programme 2006 – 2025. Ministry of Water. https://faolex.fao.org/docs/pdf/tan178947.pdf
- THE UNITED REPUBLIC OF TANZANIA MINISTRY OF WATER. (2025). National Water Policy 2002 Version 2025. https://www.maji.go.tz/uploads/publications/sw1742701826- NATIONAL%20WATER%20POLICY.pdf
- Thomas, E. A., Wilson, D., Kathuni, S., Libey, A., Chintalapati, P., & Coyle, J. (2021). A contribution to drought resilience in East Africa through groundwater pump monitoring informed by in-situ instrumentation, remote sensing and ensemble machine learning. Science of the Total Environment, 780, 146486. https://doi.org/10.1016/j.scitotenv.2021.146486
- Vrijwilligers, S. N. (2010). Water Point Mapping: The Experience of SNV Tanzania. Dar es Salaam. https://www.ircwash.org/resources/water-point-mapping-experience-snv-tanzania
- World Bank. (2022). Expanded access to water supply, sanitation, and hygiene services in Tanzania. https://www.worldbank.org/en/results/2023/11/20/expanded-access-to-water-supply- sanitation-and-hygiene-services-in-tanzania
- World Bank Group. (2017). Rural Water in Tanzania. https://documents1.worldbank.org/curated/en/923001519161501235/pdf/123624-REVISED- W17083.pdf
Figures
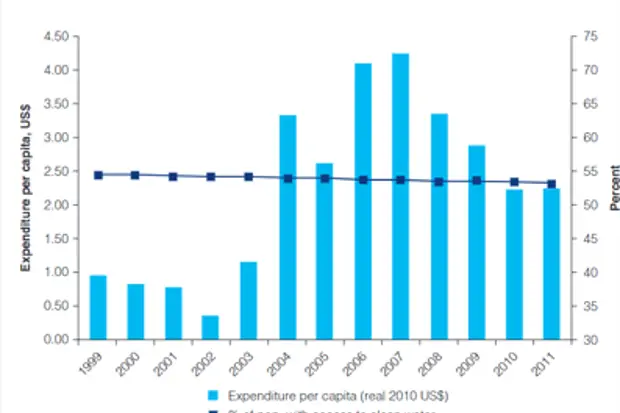
Figure a: Spending on water vs Water access
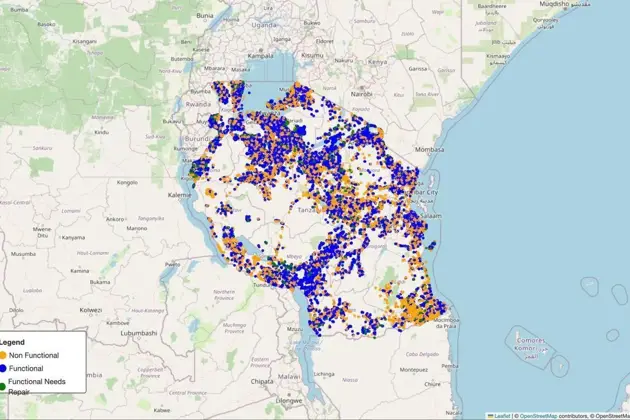
Figure b: Water point data in regions of Tanzania
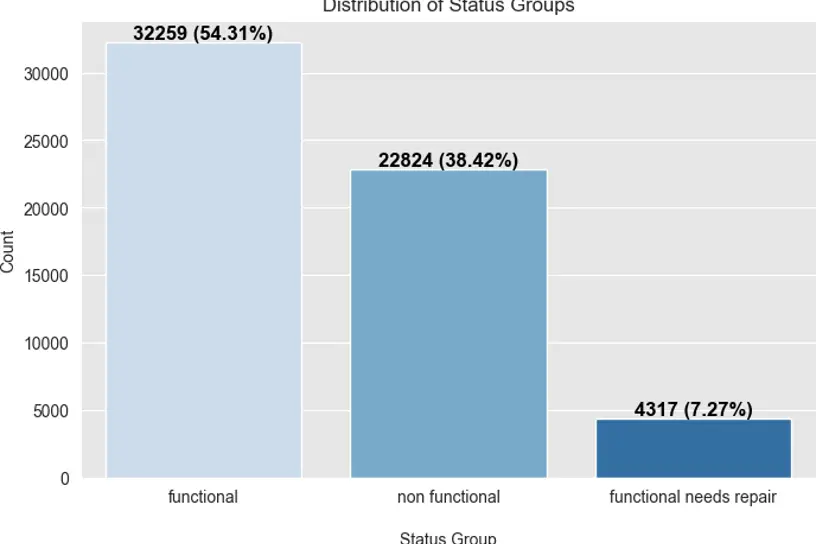
Figure c: Status group vs Count plot showing distribution of classes
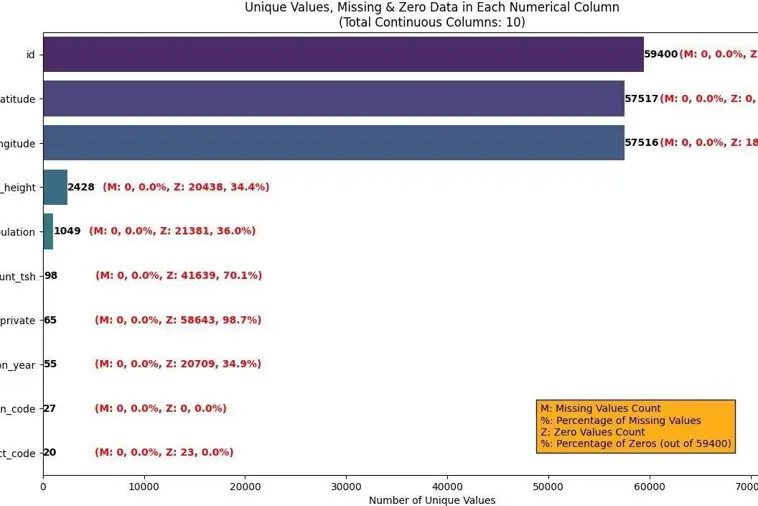
Figure d: Numerical Columns vs missing values
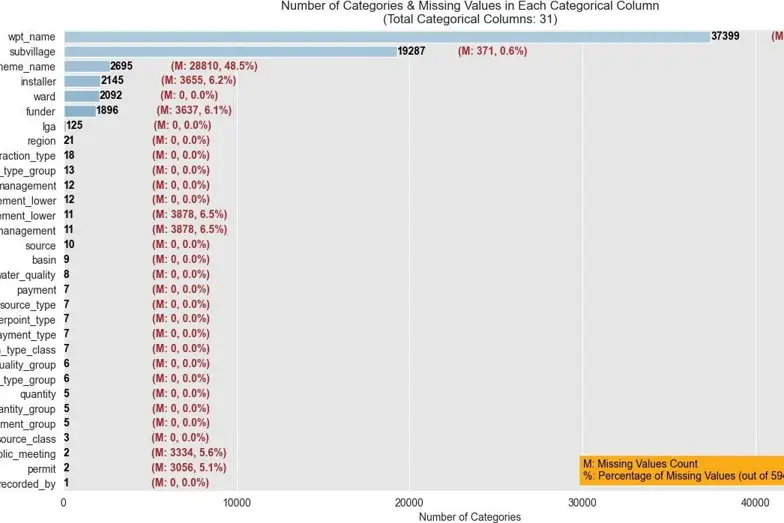
Figure e: The plot shows the number of categories in each of the columns except the target column. Most of the columns have categories that range from 5 to 18, but some of the columns have around 2000 categories
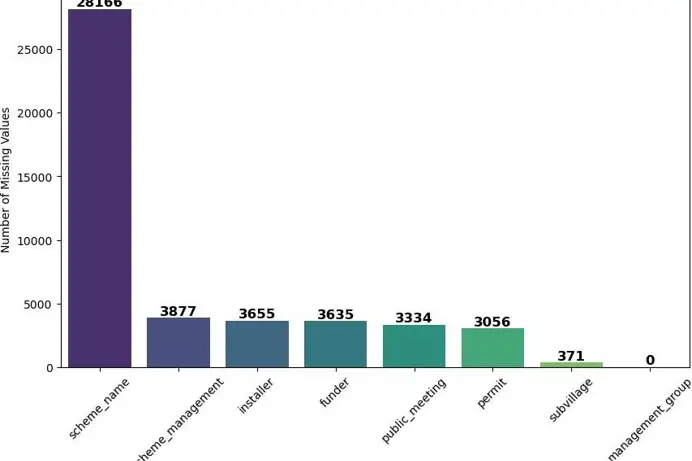
Figure f: Showing missing values of the attributes. Most of the columns do not have null values, but after further inspection, it was found that unknown or unknown was written instead of a null value
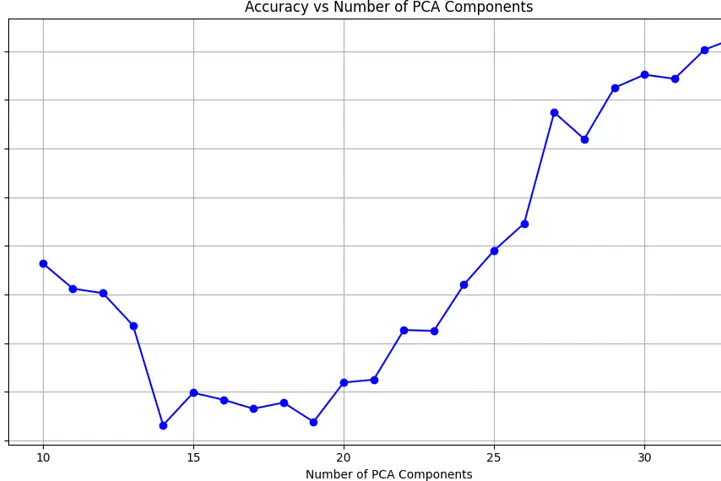
Figure g: Plot showing number of PCA components vs their respective accuracy
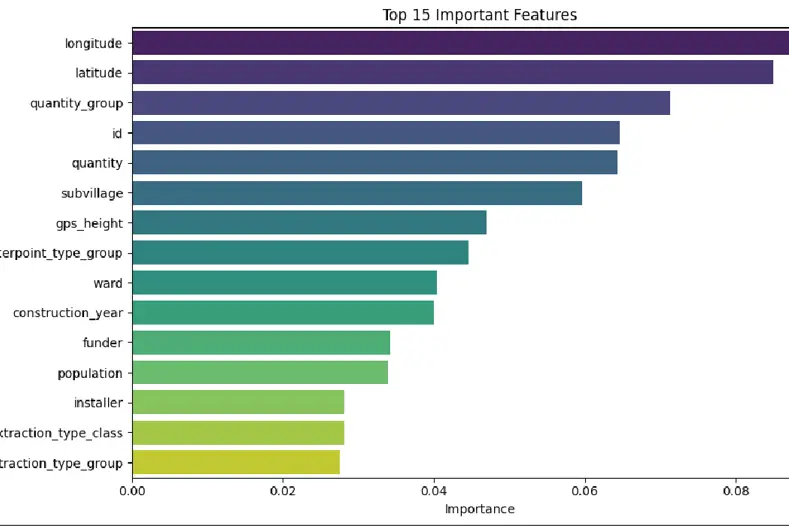
Figure h: Plot showing importance of features
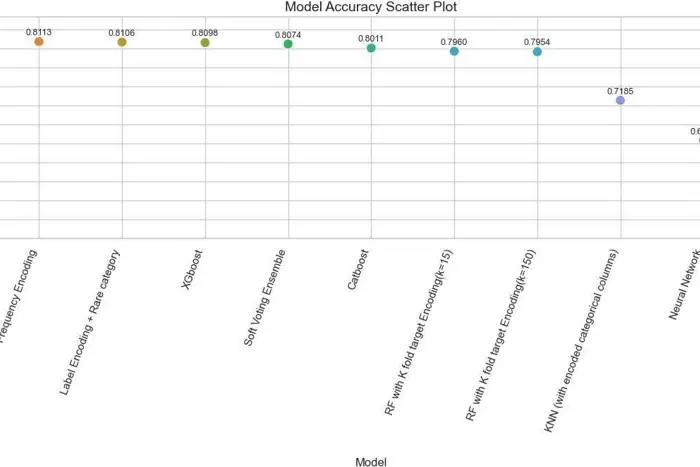
Figure i: Model Accuracy Comparison